orginio wishes happy holidays and a great new year 2022

orginio wishes Happy Holidays and a great 2022!

Hard to believe that we are already in the home stretch of 2021. We hope that you enjoyed org charting and workforce modeling with orginio this year. As we are looking back on the past months, we are happy to see quite some achievements and additions to our cloud solution making it even easier for you to create and share org charts and plan reorganizations.

orginio can be found on UKG Marketplace

orginio available on UKG Marketplace

orginio – Ingentis’ cloud application for the automated creation of org charts and easy workforce modeling – can now be found on the UKG Marketplace. UKG is a leading global provider of human capital management (HCM), payroll, HR Service Delivery, and workforce management solutions.

Workforce Modeling with orginio

Better planning of future scenarios – Workforce modeling with orginio

Companies are frequently required to adapt to changing conditions in order to become and stay successful. This is true today maybe more than ever. While these adaptations are certainly not always about the organizational structure, structural modifications are something many businesses see themselves confronted with on a regular basis. Find out how orginio can help with this.

Flexible org charts with orginio

Org charting made simple – Flexible org charts with orginio

Drawing organizational structures manually, investing hours or maybe even days in getting the job done, and by the time you are finished there have already been changes in the workforce. Does that sound all too familiar to you? Time for you to discover orginio!

orginio wishes happy holidays

Happy holidays from orginio!

Saying that 2020 was nothing like we had ever expected is probably still an understatement. A very turbulent year which had us all face new challenges is now coming to an end.

We hope that despite or maybe even because of all the prevailing uncertainty, you got to benefit from smart org charting with orginio. Even though everything seems to be a little different this year, we still want to keep some consistency and – as always – use the time before Christmas for a short recap of what has happened in the orginio world.

Advanced functionalities for workforce modeling

The world today is one of change – a sentence that has potentially never been more true than this year. Little did we know the special importance our new feature for workforce modeling would gain in the following months when we published it in March. That does not mean, however, that it is only useful in challenging times. Reorganizing corporate structures has become quite common for many companies to keep up with the ever-changing environment. With our new feature you can now model various scenarios based on your existing org chart without affecting the original one. Being able to see potential consequences of reorganizations before putting them into place allows for well-informed business decisions and consequently less risk. Find out more about this on our blog or watch the video .

More new favorite features

While the new modeling feature has already been a big improvement, we did not stop there. orginio now also offers an interactive legend for your defined display rules so that you can quickly activate or deactivate them. Additionally, it is now possible to determine default key figures to always be visualized in your organogram. Or would you like to see a person hierarchy in your org chart while the hierarchy tree displays an org unit structure? This possibility has been added to orginio just like the option to individually define the header and/or footer of your printed org charts.

Click here to find detailed descriptions of all our favorite features.


In the upcoming months, we want to make it even easier for you to visualize your HR data with orginio. Therefore, we are working on multiple new interfaces to leading HR systems. We will, of course, keep you posted about these new developments.

To bring this to a close, we would like to say thank you for trusting us and orginio during this extraordinary year. For now, we wish you and your loved ones happy holidays, a good start to the new year and lots of smart org charts with orginio in 2021!

Workforce modeling online with orginio

Modeling structures directly in your org chart

The latest version of orginio comes with a great new feature allowing you to model new structures without having to modify your main org chart.

Maybe you have already noticed the new section “modeling” in the settings. This is where you need to go to create and manage modeling charts.

Create a modeling chart for workforce modeling with orginio.

Click on the “+ MODELING” button, name the simulation, and you are all set to start modeling.

Switch to edit mode and carry out all the changes running through your mind. The options are manifold:

  • Use drag & drop to move people, positions or even whole departments to another place in the org chart
  • Add, change or delete departments, positions or people

KPIs included in your organizational chart will be updated automatically in real-time. Your initial org chart will not be affected by any changes made in the process.

You can create up to five different simulations in orginio allowing you to take into account several options. When viewing your org chart, you will be seeing a little dropdown list on top which makes it easy for you to switch between the main org chart and the modeling charts, if needed.

Navigation bar to switch between org chart viewsNavigation bar to switch between org chart views

Sharing your simulation

Oftentimes, there is more than one person working on the modeling of org structures. Therefore, it is possible, to allow other users of the main org chart to view and edit the simulation as well.

Activate the desired modeling chart in the orginio settings.

Activate the modeling chart to which you want to add users by clicking on the little “play” button in the modeling section and then navigate to “user management” in the settings. Click on “+ USERS” to add any user to your simulation and determine their permissions.

Invite others to collaborate on a workforce modeling project in orginio

Why model reorganizations?

The world today is one of change. That is also true for organizational structures.

Changes are important and necessary; however, they should be thought through thoroughly before they become effective.

orginio’s new simulation function makes it possible to visualize potential changes and see the impact on the organizational structure. Creating different options ensures well-informed decisions considering also the consequences of the reorganization before putting it into place.

Happy Holidays from orginio

Happy holidays from your orginio team!

It’s that time of the year again and as we are taking a look back on the past months we hope that orginio was of great use to you in 2018 when creating your org charts!

Maybe our cloud solution helped you share details on the org hierarchy with your colleagues? Did you integrate it into your company’s intranet portal? Or, were you able to visualize additional relations such as succession within the org chart via dotted line?

Whatever the scenario, in order to keep working with orginio easy and straightforward, we’ve published some articles this year in the orginio blog that target various possible application scenarios.
In addition, you’ll find some helpful videos on our Examples page as well as articles to cool features on the Favorite Features page. You should have a look 😉

New design for greater user experience

To further optimize the orginio user experience, we introduced a design update this year. It’s modern and fresh, and allows you to present more information in the org chart, e.g. additional details of a selected object.

Thanks to new display rules, objects can now either be blanked out or highlighted via color coding. If you haven’t tried these rules out, you should. This way, it’s so much easier to focus on the information relevant to you!

But before you dive back into org charting with orginio, we would like to wish you happy holidays and a healthy, prosperous new year!

Let there be more smart org charts in 2019! 🙂

All the ways to navigate through your orginio

Are you looking for a certain org unit or position, or do you need to know where to find a colleague?
orginio offers several ways to quickly get to the desired spot within your org chart.

Level navigation

One possibility is to move through your org chart with the help of orginio’s level navigation. Simply click onto the arrows below the org chart boxes to open the next hierarchy level.

Navigate through your org chart in orginio using the little arrows

Hierarchy tree

orginio also comes with a hierarchy tree from version advance ATTRACTIVE onwards, providing another, more compressed view of an organization’s complete command structure right next to the org chart view.
Each org level can be opened or closed via the arrow symbol. By clicking on an object within the tree, you are navigated to the respective box within the org chart.

Zoom to fit

Is it easier for you to find what you are looking for with an overview in front of you? In that case, just click the button “Zoom to fit” and your org chart will be fit to your screen size.

Make your online org chart fit to screen by clicking on the icon

Search function

Last but not least, orginio’s search function allows you to get directly to the desired entry point in your org chart. Type the name of the respective person, position or org unit into the entry field and select the right hit from the drop-down list.

Related links:

Publish, share and print online org charts with orginio

How to publish, share and print org charts

In our blog article „The benefits of orginio“ we already pointed out how an org chart can be beneficial to different groups of people within an organization. But first, it needs to be made available to them. So, in case you have just finalized or updated your org chart, here are some ways to share it with your colleagues.

Publish on the intranet

In order to reach as many co-workers as possible, you can publish your organogram on your company’s intranet. All you need is the access key, a public link, which you integrate into the portal. The access key comes with the great advantage that existing access rules are in effect.
Find a more detailed description on how to generate the access key and publish your orginio in the article “Integrate your org chart into your intranet portal”.

Share

The entry link – read more about it on the favorite features page – is not only helpful if you’d like to bookmark a certain point of the hierarchy structure to come back to if needed.
The entry link can also be shared with co-workers to inform about or discuss a certain view of the org chart.
Make sure that your colleagues are logged in before using the link as access rules apply.

Print

Printing org charts from orginio is really easy. Click the print button in the settings bar to receive either a PDF or an image file (your choice!) of the displayed boxes. In this case, what you see is what you get.

Click on the printing icon in the settings bar to print your org chart or create a PDF

Visualizing organizational relationships in your org chart

Ingentis HR gimmicks


By Kelly O’Hara


Relationships within an organization are neither simple nor one-way. Therefore, it’s not enough to display a standard hierarchical structure when trying to point out the deeper connection of co-workers. As mentioned in an earlier article about organizational visualizations, illustrating relationships that are cross-departmental, project-based, or otherwise outside of an employee’s regular reporting structure helps HR and managers see all areas of the organization that an employee touches. So let’s have a look at different visualization possibilities in this next Ingentis HR gimmick.

Why visualize relations

Structures and relationships in organizations aren’t always black and white. For example, an employee can directly report to one team or manager but also work closely with another team. Or, there is a special connection between two colleagues that may not have too much impact on the everyday work life but is generally of great importance, e.g. a mentorship. This is why it’s very helpful to use different visualizations to highlight specific connections.

Solid and dotted lines

The most common way to do this is by implementing solid and dotted line structures.
The solid line is also known as legal line and typically represents the reporting structure concerning for example vacation requests, everyday workflows and legal processes. Dotted lines on the other hand can be a bit more nuanced and are implemented differently amongst companies. Here are some examples:

Mentors

At first sight, it may not seem necessary to include a mentorship on an org chart, but they can be helpful for oversight especially during employee onboarding. If your company has a formal mentor program for new employees, it can help to keep track of who is working with whom, or show if there are enough mentors for all the new employees.

Successors

To assume that your org chart is set in stone and that no one will move away from the company or change roles only hurts you in the long run. Org charts are constantly changing due to joiners and leavers, promotions, or role changes. One way to stay on top of these changes and make transitions easier for your organization and teams is to implement a successor program.
Not every role needs an official successor documented, but high- to mid-level managerial positions can benefit from having a successor in place. Successors can be visualized on an org chart through the use of dotted lines. This allows both HR and upper management to track a successor’s relationship with their current and future role and make sure that processes are in place for future success.

Deputies

Another reason to work with dotted lines is to point out one’s deputy. Let’s say, you’re planning on going on a sabbatical. Your colleagues will need to know who to get in touch with once you’re out of office. Implementing dotted lines in your org chart is a quick and easy way for them to find the answer. No need for the time-consuming questioning of several co-workers in vain – it’s all there, in your organogram.

Network visualizations

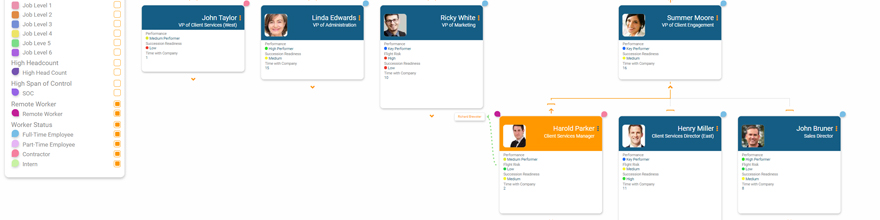
One valuable structure to document is that of agile networks, such as project teams. These networks are typically temporary and comprised of employees from multiple departments. For example, a product launch would require employees from product, engineering, and marketing to work together closely. A customized relation, illustrated as what we call a network visualization, could connect all team members, including the project team lead.
To avoid confusion, this network visualization would not be part of the default org chart but an additional view.
As a result, the default org chart would provide an overview of the legal structure while the network visualization shows how many project teams there are and who is part of them.

Both our org charting solutions Ingentis org.manager and orginio offer the possibility of highlighting relationships via dotted line. In addition, Ingentis org.manager enables network visualizations. To find out more about the software, visit:

Ingentis org.manager 
orginio